
Analyzing Intersection Crash Trends Across New Jersey
Request a Free Consultation
Key Takeaways:
- Over five years, New Jersey recorded 279,622 intersection crashes.
- Newark, located in Essex County, had the most intersection crashes among municipalities, with 23,183 collisions in total.
- Cumberland County leads in injury-related crashes, with 42% of its 4,617 intersection crashes resulting in injuries. Meanwhile, Hunterdon County reports the lowest injury rate at 20.78% of its 5,391 crashes.
- Hunterdon County saw the most significant decrease, with a 33% reduction in intersection crashes over five years. However, the proportion of crashes resulting in injuries or fatalities increased during this period.
- Sussex and Hunterdon counties report the highest proportions of deer-related intersection crashes, accounting for 15% and 13% of all intersection crashes, respectively.
- Hudson County has the highest share of pedestrian-related intersection crashes at 5%, significantly higher than other counties.
As the most densely populated state in the country, New Jersey’s roads bear the weight of millions of vehicles daily. This makes effective traffic management a necessity. The state’s distinctive intersection designs, such as jughandles to eliminate direct left turns and overpasses to maintain traffic flow, are a direct response to these demands.
While these innovations aim to improve safety and efficiency, they also present challenges. Jughandles can confuse unfamiliar drivers, leading to erratic lane changes, while complex overpasses may obscure visibility or create risky merging conditions. Coupled with the steady influx of out-of-state drivers navigating these layouts, New Jersey’s intersections offer a unique case study in road safety. Nationally, a quarter of all crashes occur at intersections, and New Jersey is no exception. Over the past five years (2018-2022), 279,622 collisions have occurred at these high-traffic junctions.
In this article, we analyze intersection crash patterns by county to identify the most dangerous locations and examine the factors contributing to these accidents.
Exploring Intersection Crash Incidents by County
New Jersey’s intersection crash data reveals that certain counties bear a greater burden of accidents and injuries. View the table below to explore the regions most impacted by these incidents.
New Jersey counties show considerable variation in intersection crash counts and their severity. Essex and Bergen lead with 46,723 and 38,467 intersection crashes, accounting for 35% and 30% of all crashes in their respective counties. Passaic County also stands out with one of the highest total crash counts and the largest share of intersection crashes at 38%.
In contrast, smaller counties like Salem and Cape May report just 2,602 and 1,349 crashes, with shares of 22% and 17%. Cumberland County has the highest proportion of injury-related crashes, with 42% of its 4,617 intersection crashes resulting in injuries, despite its lower crash total. Meanwhile, Hunterdon County reports the lowest injury share at 21% of its 5,391 crashes. Populous counties like Essex (13,675) and Bergen (10,437) contribute the most in absolute numbers.
Localized Look at Intersection Crashes
In terms of local impact, the following table outlines the top 15 municipalities with the highest intersection crash totals over a five-year period, offering a closer look at where efforts to improve road safety should be concentrated.
Newark, located in Essex County, leads with a substantial 23,183 intersection crashes, followed by Paterson in Passaic County with 14,513 crashes. Other notable municipalities include Jersey City, Elizabeth, and Trenton. We also identified the city in each county with the most intersection crashes and the percentage of those crashes relative to the county’s total.
Newark, the most populated city in New Jersey, accounts for nearly half of all intersection crashes in Essex County. Meanwhile, Vineland in Cumberland County has the highest share of intersection crashes relative to its county’s total compared to any other city on the list.
A Timeline of Intersection Crashes
Next, we explore how intersection crash trends have evolved in each New Jersey county over the past five years. You may interact with the visualization for a better view of each county’s trend.
The line chart above illustrates the yearly trends in intersection crash counts for New Jersey counties from 2018 to 2022. Most counties, except Atlantic, Cape May, Cumberland, Gloucester, Ocean, and Salem, experienced a decrease in intersection crashes over the five-year period. Hunterdon County saw the most significant decrease, with a 33% reduction in crashes. Several counties also experienced a dip in intersection crashes in 2020, with only 3 counties being the exception: Cape May, Sussex, and Warren. However, Hunterdon county was the only county that was able to keep the reduction going the next two following years.
In the following two graphs, we take a closer look at intersection crashes over the last year by illustrating how the share of total crashes and the share of those resulting in injury or fatality have changed for notable counties, Sussex and Hunterdon. 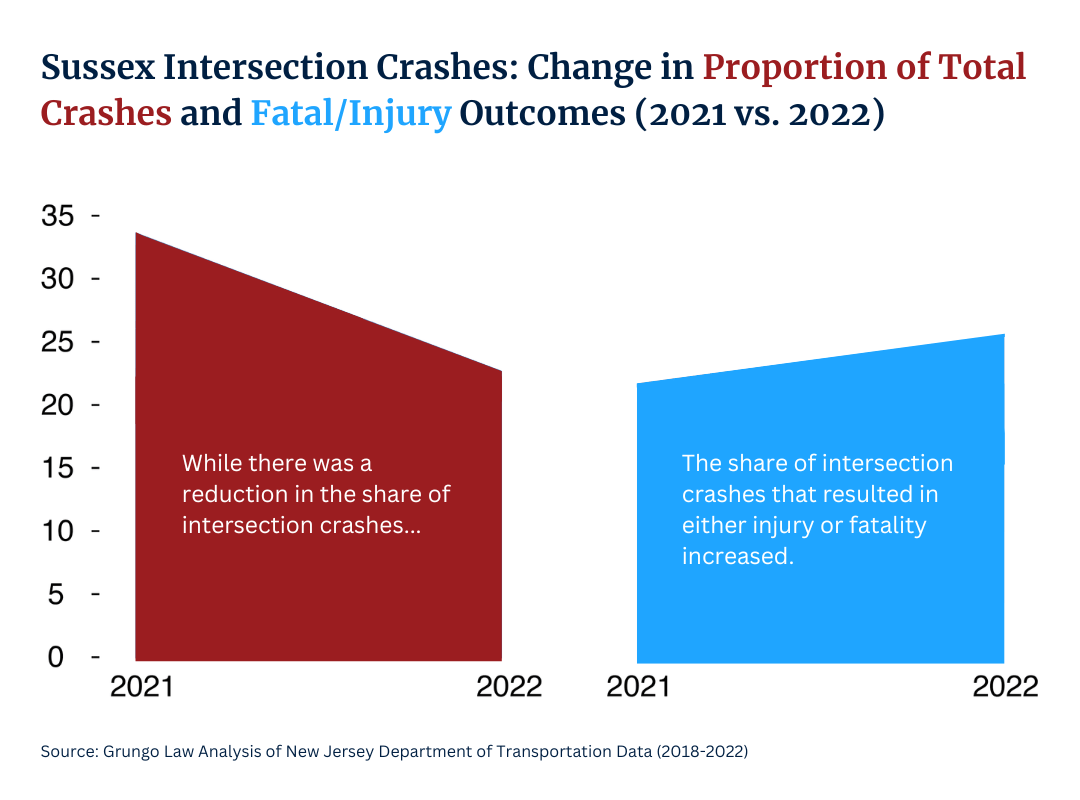
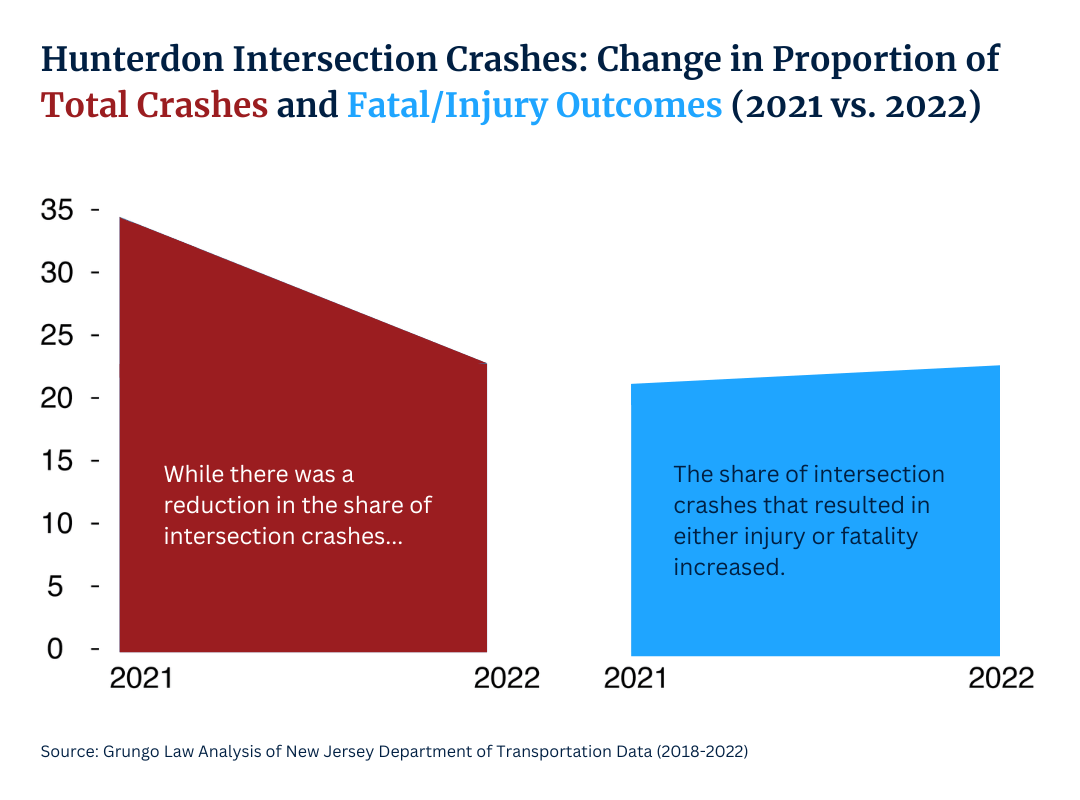 One might typically assume that as the number of intersection crashes decreases, so too would the number of crashes resulting in harm. While this held true for most counties, there were notable exceptions. This is why we chose to highlight Sussex County and Hunterdon County with their own graphs. Hunterdon County experienced the most significant decrease in intersection crashes from 2021 to 2022; however, the proportion of crashes resulting in injuries or fatalities increased. Similarly, Sussex County exemplified this trend, recording the largest increase in injury- or fatality-causing crashes among all counties.
Context Surrounding Intersection Crashes
To further understand the factors contributing to intersection crashes, the following graph highlights the most common events leading to these incidents.
The majority of intersection crashes stem from routine driving activities (motor vehicles in transport). The second most common cause involves parked motor vehicles, followed by incidents involving pedestrians, curb collisions, deer, and pedalcyclists. We also analyzed these events by county.
Sussex and Hunterdon counties stand out with their higher-than-average shares of deer incidents for intersection crashes. These counties are more rural in nature, with large areas of undeveloped land, forests, and farmlands, which provide ideal habitats for deer. As a result, drivers in these areas are more likely to encounter deer while driving, leading to a higher number of deer-related crashes. New Jersey has also been experiencing issues with deer overpopulation, which exacerbates the situation in rural areas like Sussex and Hunterdon. Cape May also stands out for crashes involving pedalcyclists. Motorists are more likely to crash with a pedalcyclist here than in any other county. Similarly, the same can be said for pedestrian crashes in Hudson. The higher number of pedestrian and pedalcyclist crashes in these counties may be attributed to the walkability and bike-friendly infrastructure of these areas. Hudson, in particular, has a dense urban environment with more foot and bike traffic, increasing the likelihood of these types of accidents.
Deer-Related Intersection Crashes
Here, we provide absolute numbers of deer-related intersection crashes by county, along with its share among all types of intersection crashes.
As previously mentioned, Sussex County and Hunterdon County reported the highest proportions of deer-related intersection crashes, at 15% and 13%, respectively. In absolute terms, Sussex County also had the highest number of these incidents at 673 encounters. Additionally, our analysis revealed that deer collisions are more likely to occur in November and December, with 61% of deer-related intersection crashes happening in the dark.
Pedestrian-Related Intersection Crashes
Below is a table summarizing key statistics on pedestrian-related intersection crashes, including their total count, share of all intersection crashes, and resulting pedestrian fatalities.
Hudson County stands out with the highest share of intersection crashes involving pedestrians at 4.51%, significantly higher than any other county. This aligns with its dense urban environment, where pedestrian activity is more prevalent. Additionally, Essex County reports the highest total number of pedestrian-related intersection crashes, with 1,308 incidents, which is also representative of its high traffic volumes. In terms of fatality counts, Essex, Hudson, Passaic, and Bergen report the highest numbers. These figures suggest a need for better infrastructure or enforcement in these areas to reduce the severity of crashes.
Targeting Regional Intersection Safety
New Jersey’s dense population and complex road layout make its intersection safety a critical area of focus. While certain road designs may alleviate congestion and improve flow, they also create challenges for unfamiliar drivers. These factors may contribute to the state’s number of intersection crashes, with some counties exhibiting higher proportions than others. Our analysis shows notable differences in intersection crash patterns across the state. While counties like Essex and Bergen, among the most developed counties, face the highest total crash numbers, more rural counties such as Sussex and Hunterdon are grappling with specific issues like deer-related accidents.
Additionally, a concerning increase in injury and fatality rates, even in counties with fewer total crashes, calls for targeted intervention and safety measures. Fortunately, New Jersey is among the states that have embraced Vision Zero, a commitment to eliminating all traffic-related fatalities. Many cities have already implemented successful road safety strategies under this initiative. By targeting areas and crash types most in need of attention, the state can prioritize safety and reduce intersection-related accidents. Effective, data-driven strategies will help ensure that all drivers, cyclists, and pedestrians on New Jersey’s roads can navigate safely and confidently.
Methodology
We analyzed five years of data (2018-2022) from the New Jersey Department of Transportation to explore intersection crash trends.
Fair Use Statement
We hope you find this article insightful and useful. You’re welcome to share our findings, and we kindly request that you include a link back to this page to ensure proper credit.